
All kinds of things can go wrong in the Windows operating system. To identify which process or component is causing problems you can use perfmon (“performance monitor”) or (“Performance Monitor”).
Through perfmon you can view the performance of your system and the processes running on it. It gives you a way to view information related to these processes and tie them to the effect they have on your system.
This information is stored in perfmon reports that you can view via monitors after starting a collector set. This gives you insight into where things go wrong. Perf mon is a tool that requires some specialist knowledge.
How to use the Performance Monitor or Perfmon in Windows 11
To open the performance monitor, right-click on the Start button. In the menu click on Run. In the run window type: perfmon
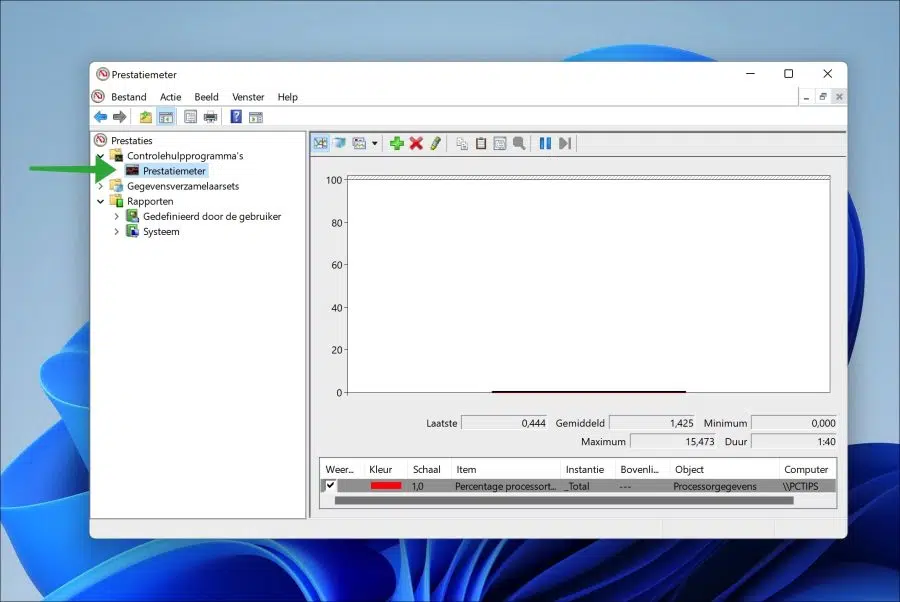
Once you have opened perfmon you will see various tools on the left.
First you will see the performance meter in the “Monitoring Tools”.
Performance meter
The performance monitor is primarily intended for viewing real-time statistics. By default, only one counter is selected; the “percent processor time” counter.
However, you can add additional counters by clicking the green plus sign. This way you can view any desired counter in real time. The performance meter therefore immediately displays information about your computer in real time.
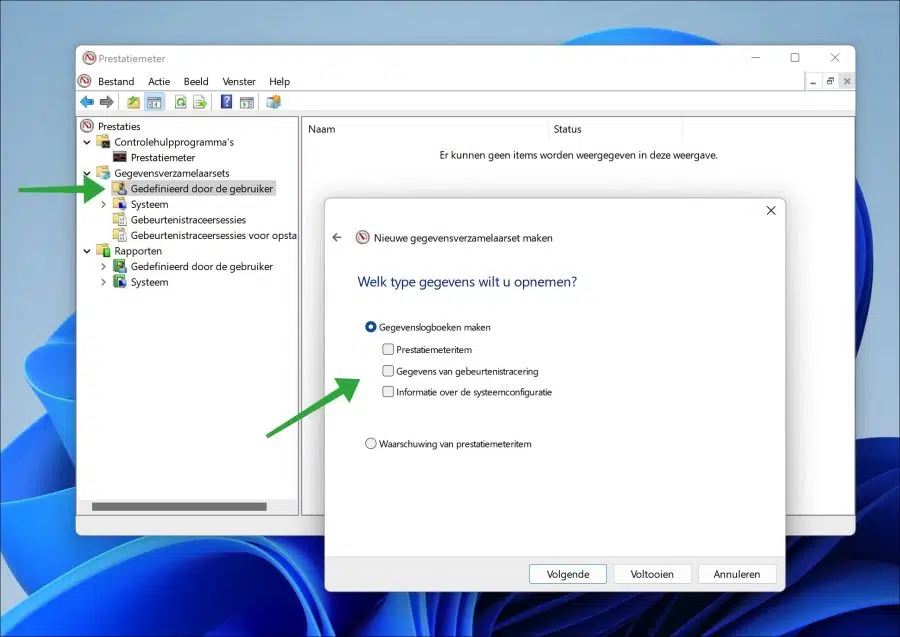
Data collector sets
Data collector sets collect data from your system so you can view changes in configuration and performance data over time.
There are three different collector sets. These are the “performance counter”, “event tracking data”, and “system configuration information”.
Performance counter item
This allows perfmon to capture data based on the poll of an event at a certain time interval.
Event tracking data
This allows perfmon to capture data based on events that occur rather than based on a specific time interval.
System configuration information
This allows perform to collect system configuration data.
You can all define these collector sets in the “User Defined” sets.
In addition to defining specific collector sets by the user, two standard collector sets can also be used in perfmon.
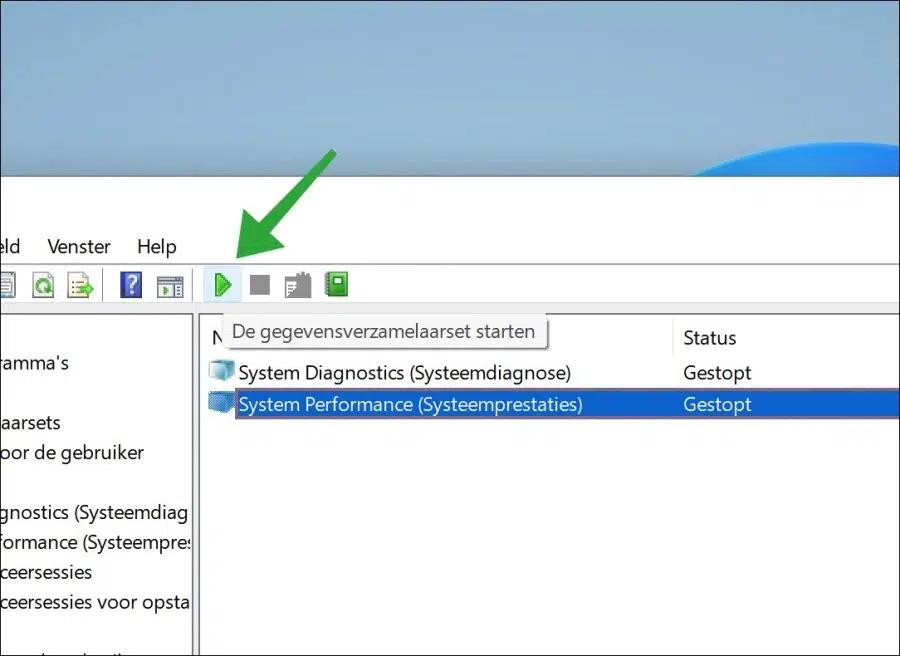
These are the “System Diagnostics” and “System Performance” collector sets. If you suspect that your PC is not functioning properly, it is advisable to start collecting data via one of these two sets.
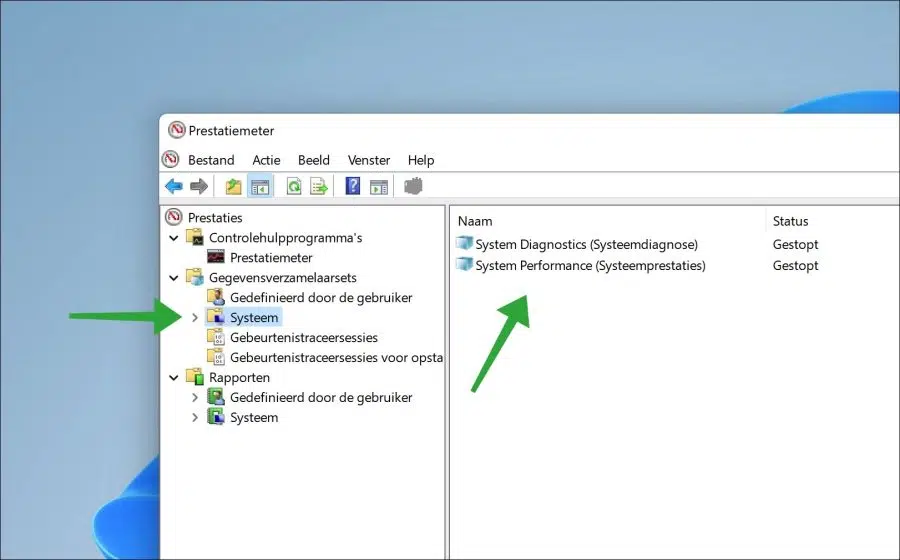
Click on the collector's set and then click “Start”.
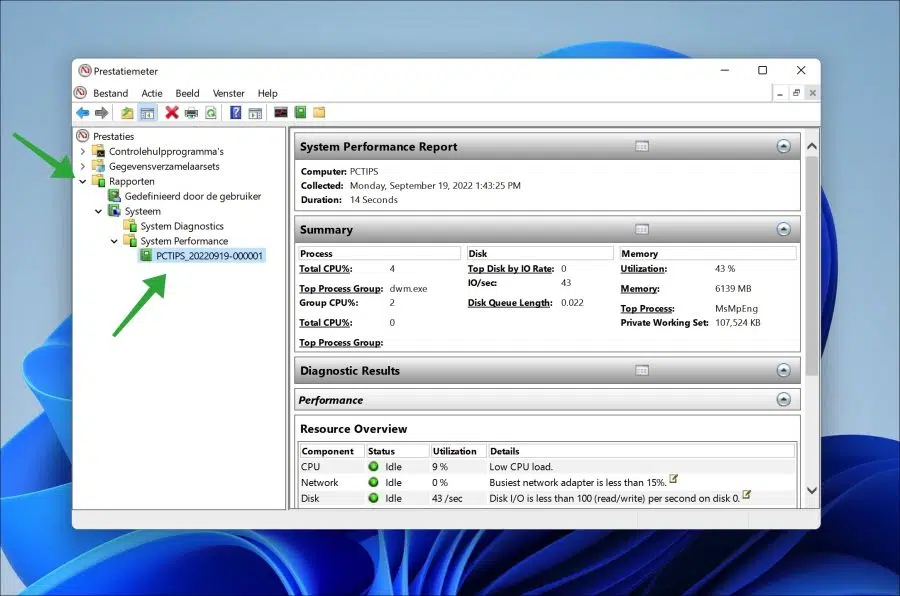
If you have started a “defined by user” set, you will see the data from the collector set in the “Reports”. This also applies to one of the two standard collector sets “System Diagnostics” and “System Performance”.
When you open the report you will see the collected data. This report shows the collected data from the period that the collection set was active via perfmon. Depending on your own compiled collection set or the standard set, you will see the data.
I hope I have informed you with this. Thank you for reading!