
Hebt u zich ooit afgevraagd wat er achter de schermen van uw Google Chrome browser gebeurt terwijl u surft, werkt of speelt op internet? Met de Tracing Viewer voor Chrome, een tool die gedetailleerde informatie verzamelt over uw browseractiviteiten en webtoepassingen, kunt u nu diep in de werking van Chrome duiken.
Deze tracing tool geeft een reeks gebeurtenissen visueel weer. Van het renderen van pagina’s en het uitvoeren van JavaScript tot het laden van netwerkbronnen. Allemaal gerangschikt in een tijdlijn. Zo kunt u niet alleen zien hoe lang verschillende taken duren om uit te voeren, maar kunt u ook analyseren hoe deze taken de algehele prestaties van uw browser beïnvloeden. Of u nu een ontwikkelaar bent die manieren zoekt om de efficiëntie van uw webapplicaties te verbeteren of gewoon iemand die gefascineerd is door geavanceerde Google Chrome functies, dit artikel tot met informatie over de Google Chrome tracing viewer zal u helpen om de kennis die nodig is om de browserprestaties te verkennen en te begrijpen.
Analyseer Google Chrome of web app prestaties met tracing
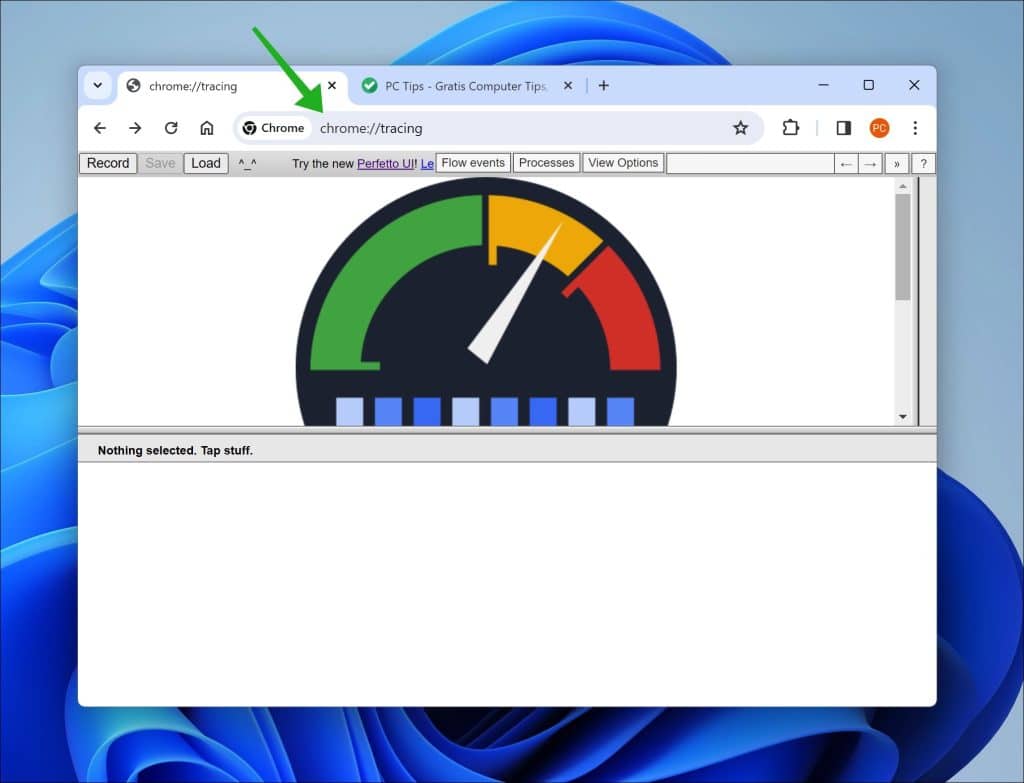
Om de tracing viewer in Google Chrome te openen typt u in de adresbalk: chrome://tracing/
Meld u dan aan voor onze nieuwsbrief.
Klik op de knop “Record” om het opnameproces te starten. U kunt kiezen uit verschillende opnamecategorieën, afhankelijk van het soort gegevens dat u wilt verzamelen. Er zijn opties voor het traceren van de renderer, de browser, de GPU, en meer.
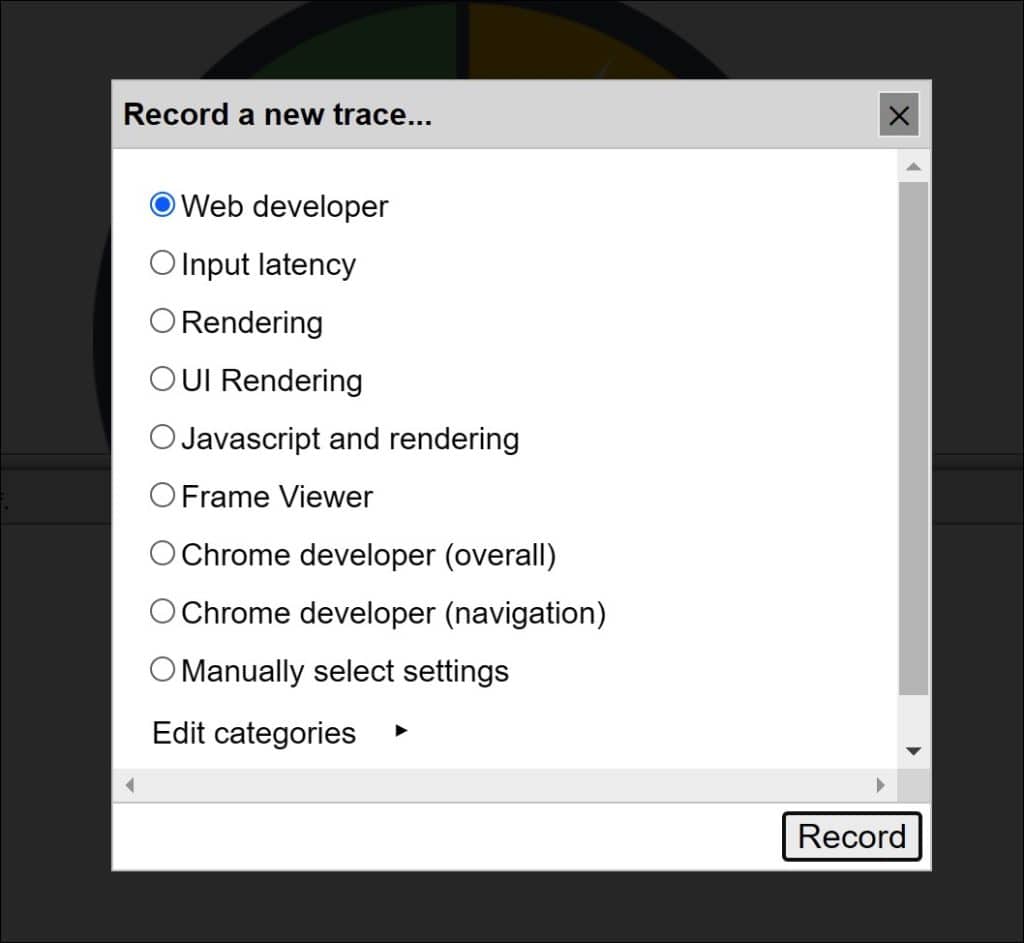
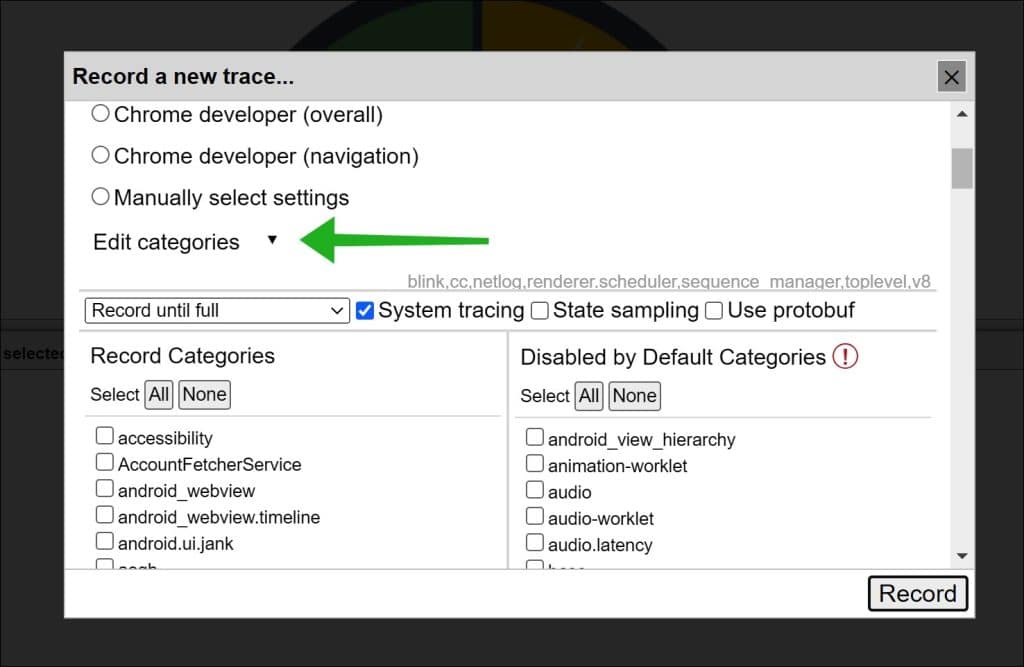
U kunt ook aangepaste configuraties instellen voor meer gerichte analyses. Nadat u de gewenste categorieën heeft geselecteerd, start u de opname.
Voer eerst de gewenste acties uit in Chrome die u wilt onderzoeken. Als u klaar bent om de opname te stoppen, klikt u gewoon op de knop “Stoppen”.
Zodra u de opname hebt gestopt, wordt een tijdlijn weergegeven met gebeurtenissen en taken met een kleurcode op basis van hun type. U kunt inzoomen op tijdsintervallen en met de muis over individuele gebeurtenissen gaan voor meer gedetailleerde informatie. Dit hulpmiddel biedt een overzicht van de prestaties, inclusief de begin- en eindtijden van taken, hun duur en zelfs de stack van JavaScript-functies.
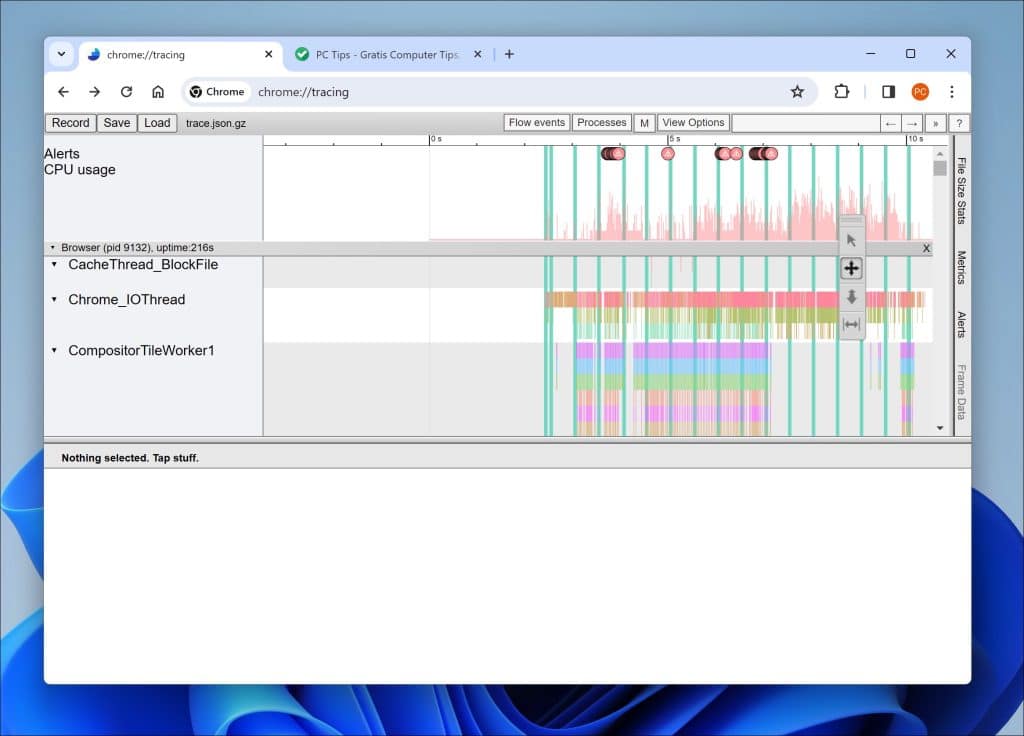
Door deze gegevens te analyseren krijgt u inzicht in hoe taken worden uitgevoerd, identificeert u eventuele vertragingen en observeert u hoe verschillende processen op elkaar inwerken. Besteed aandacht aan taken die ervoor kunnen zorgen dat de UI thread niet meer reageert, omdat ze de algehele reactiesnelheid van de applicatie kunnen beïnvloeden.
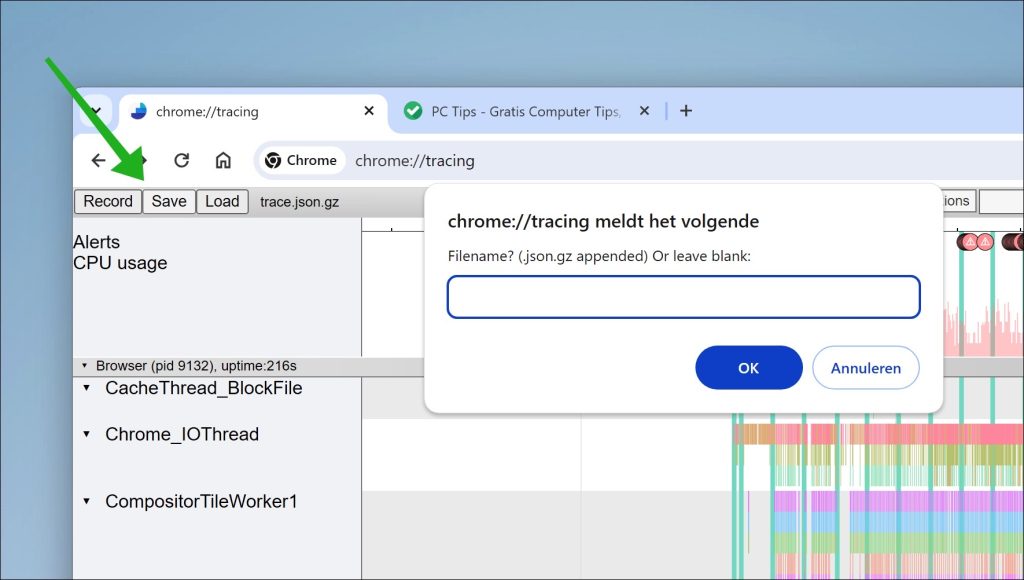
Indien nodig kunt u de tracebestanden exporteren om ze met anderen te delen of ze op uw computer importeren voor analyse.
De data die u ziet of wil tracen is sterk afhankelijk van wat voor app, website of UI u probeert te debuggen. Ik hoop u hiermee geïnformeerd te hebben. Bedankt voor het lezen!
Lees meer:
Help mee
Mijn computertips zijn gratis en bedoeld om andere mensen te helpen. Door deze pc-tip te delen op een website of social media, helpt u mij meer mensen te bereiken.Overzicht met computertips
Bekijk ook mijn uitgebreide overzicht met praktische computertips, overzichtelijk gesorteerd per categorie.Computerhulp nodig?
Loopt u vast met uw pc, laptop of software? Stel uw vraag op ons computerforum en krijg gratis computerhulp van ervaren leden en experts.